I help companies to optimize their strategies, build automated ETL pipelines ready for later use and solve data related problems with mathematical modeling and visualizations. I mainly worked on problems that are related to Operational Research, Natural Language Processing, Process automation, optimizing ETL pipelines and defining metrics.
Contact Ali
Master’s graduate in Applied Mathematics with 5+ years of experience in statistical learning, optimization, and data-driven decision-making. Proficient in R, SQL, Python, and Power BI for data transformation and visualization. Experienced in end-to-end machine learning modeling in financial contexts and developing production-ready optimization models tailored to customer requirements.
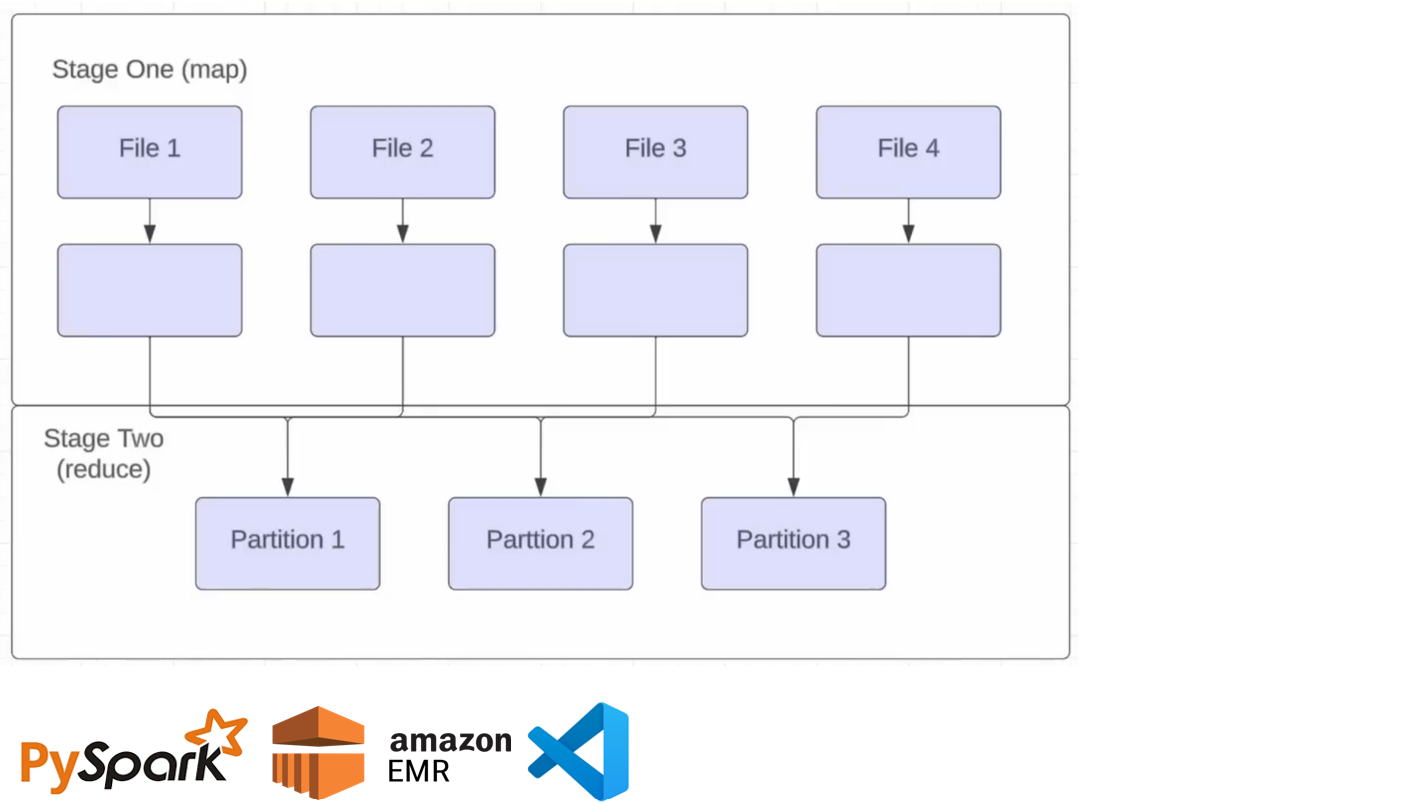
About MeDeveloped a PySpark job optimized regarding joins, UDFs, broadcasting and bucketing to reshape data into metrics to analyze and deployed it using EMR AWS service Link to PySpark example of created jobs
Developed a pipeline for data loggings into website from different browsers and device. The pipeline consisted of transforming data for later quick-advanced analysis and compacting the loggings activities to 12x per month Link to SQL Script
Developed and deployed a data pipeline for movie and actor analysis using PostgreSQL. Implemented a Slow Changing Dimensions (SCD) type 2 table, optimized incremental and full backfilling techniques—reducing data processing time by nearly 30x for 1970 to 2020— and compacted multiple rows into single entries using Common Table Expressions (CTEs). This enabled detailed historical analysis and real-time data updates, providing valuable insights into actors' performance trends and production year statistics. Link to SQL Script
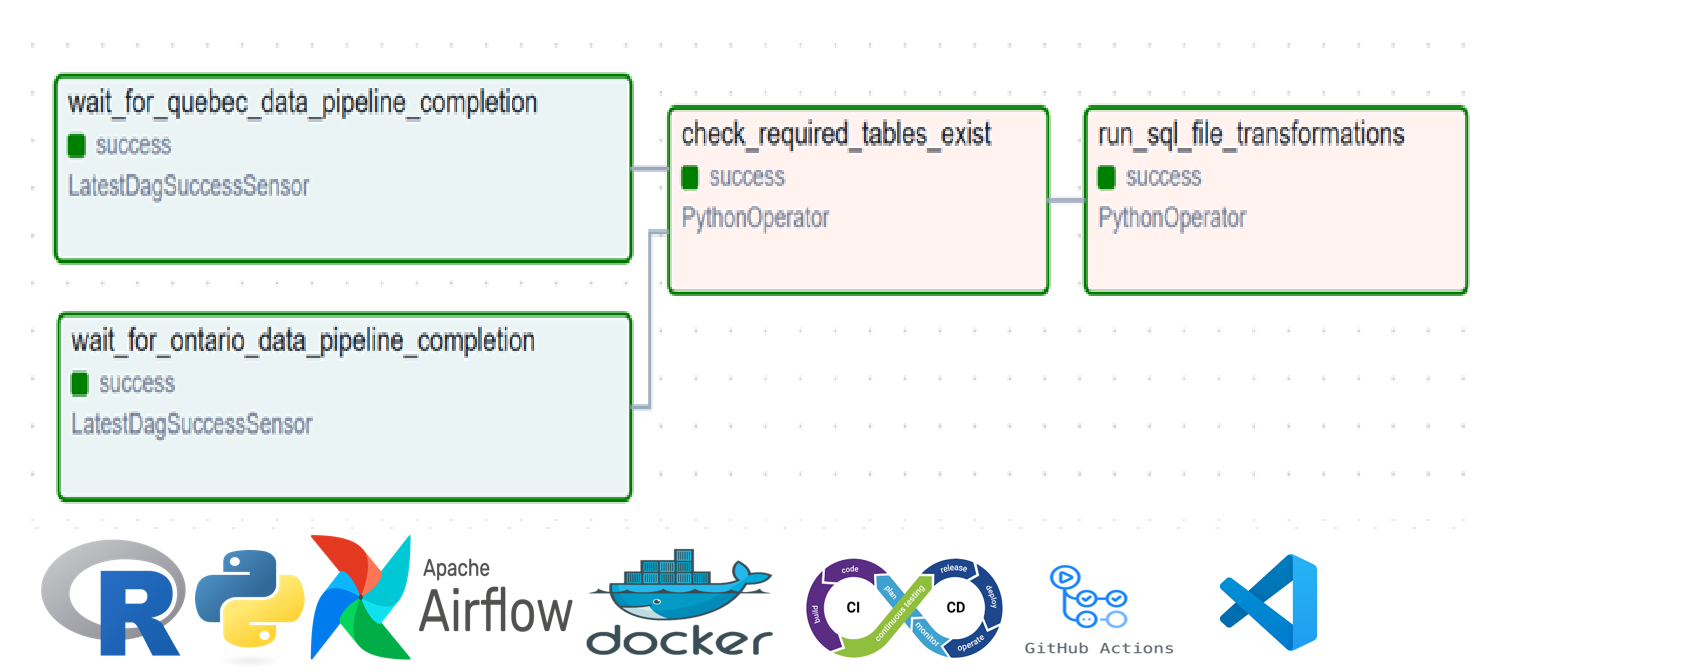
Developed ETL functions to collect Toronto data from open APIs. Functions are tested automatically after each update for quality code and resultant data. different parts of the pipelined are dockerized and designed to communicate within a network to update attached volumes. ETL pipeline jobs are scheduled using Airflow DAGs and Github actions. Discover more in my github repository!
Developed and deployed an interactive expenditure dashboard for RONA using Power BI. The dashboard integrates and visualizes financial data from multiple sources that where preprocessed and normalized, providing insights into total expenditures, category-wise breakdowns, supplier analysis, and fiscal trends.
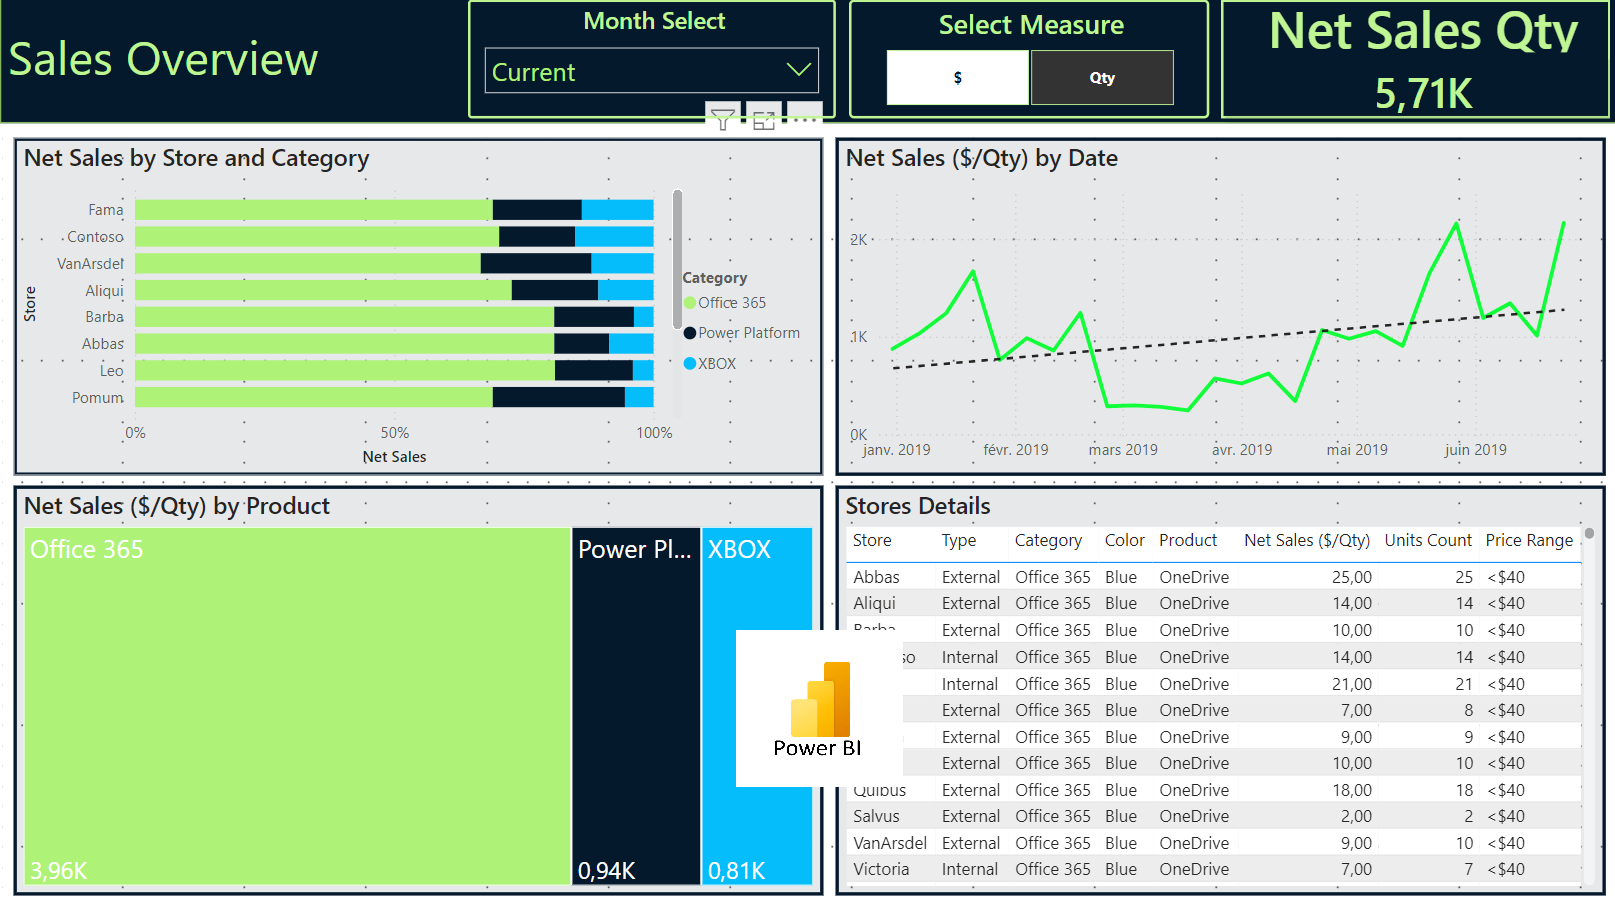
Developed a comprehensive sales dashboard for IT products at Alten using Power BI, where I integrated and normalized raw sales data from multiple sources through Power Query. I created dynamic measures with DAX for real-time insights and designed interactive visualizations to highlight key metrics like net sales quantities and category-wise breakdowns. This project involved advanced data processing techniques and aimed to empower stakeholders to make informed decisions based on detailed data insights.
Developed a shiny application that automates ANOVA statistical insights and conclusions for a lab processing Olive oil in Tunisia Get Sample of data here
Launch ApplicationFeel free to generate Sankey graph with my modest tool, as indicated to visualize your flow of data as you wish! Get Sample of data here
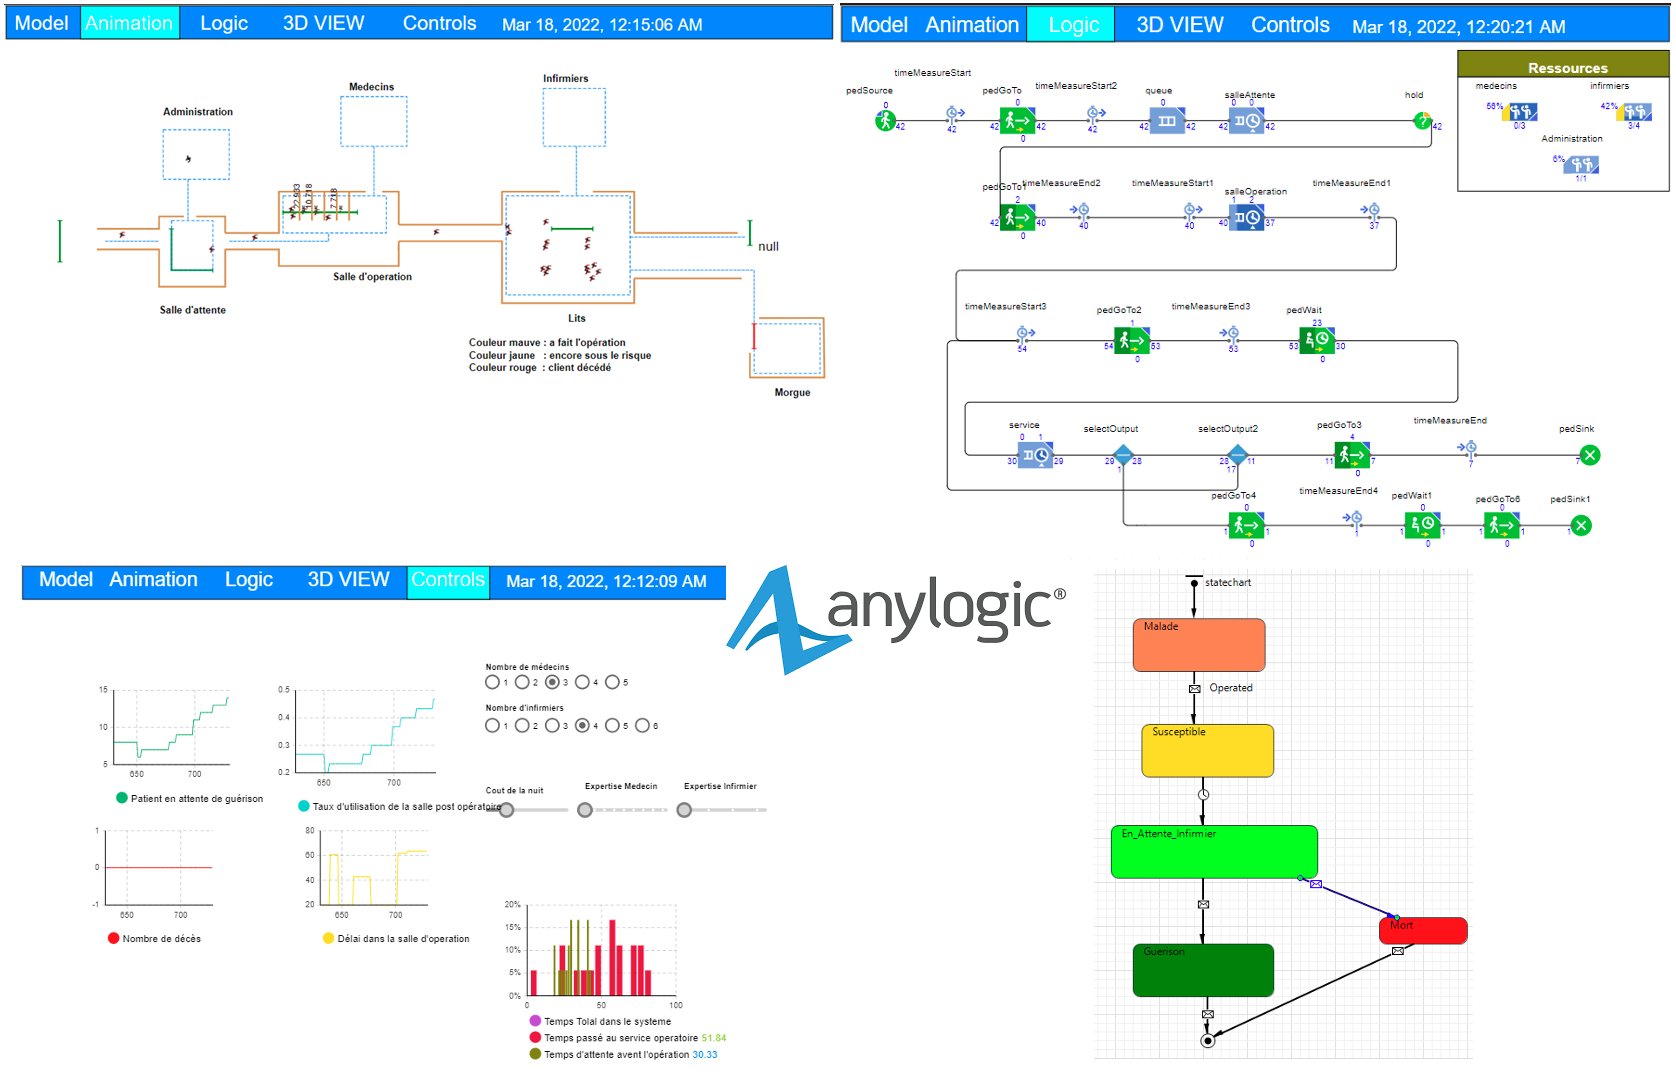
Launch ApplicationDeveloped a multi-agent-based simulation to mimic ICU performance across various scenarios, based on assumptions and parameters, to support decisions on workforce rescaling and agile performance.
This is a conference article of my work on MILP for client-tailored cleanrooms production planning published in Springer
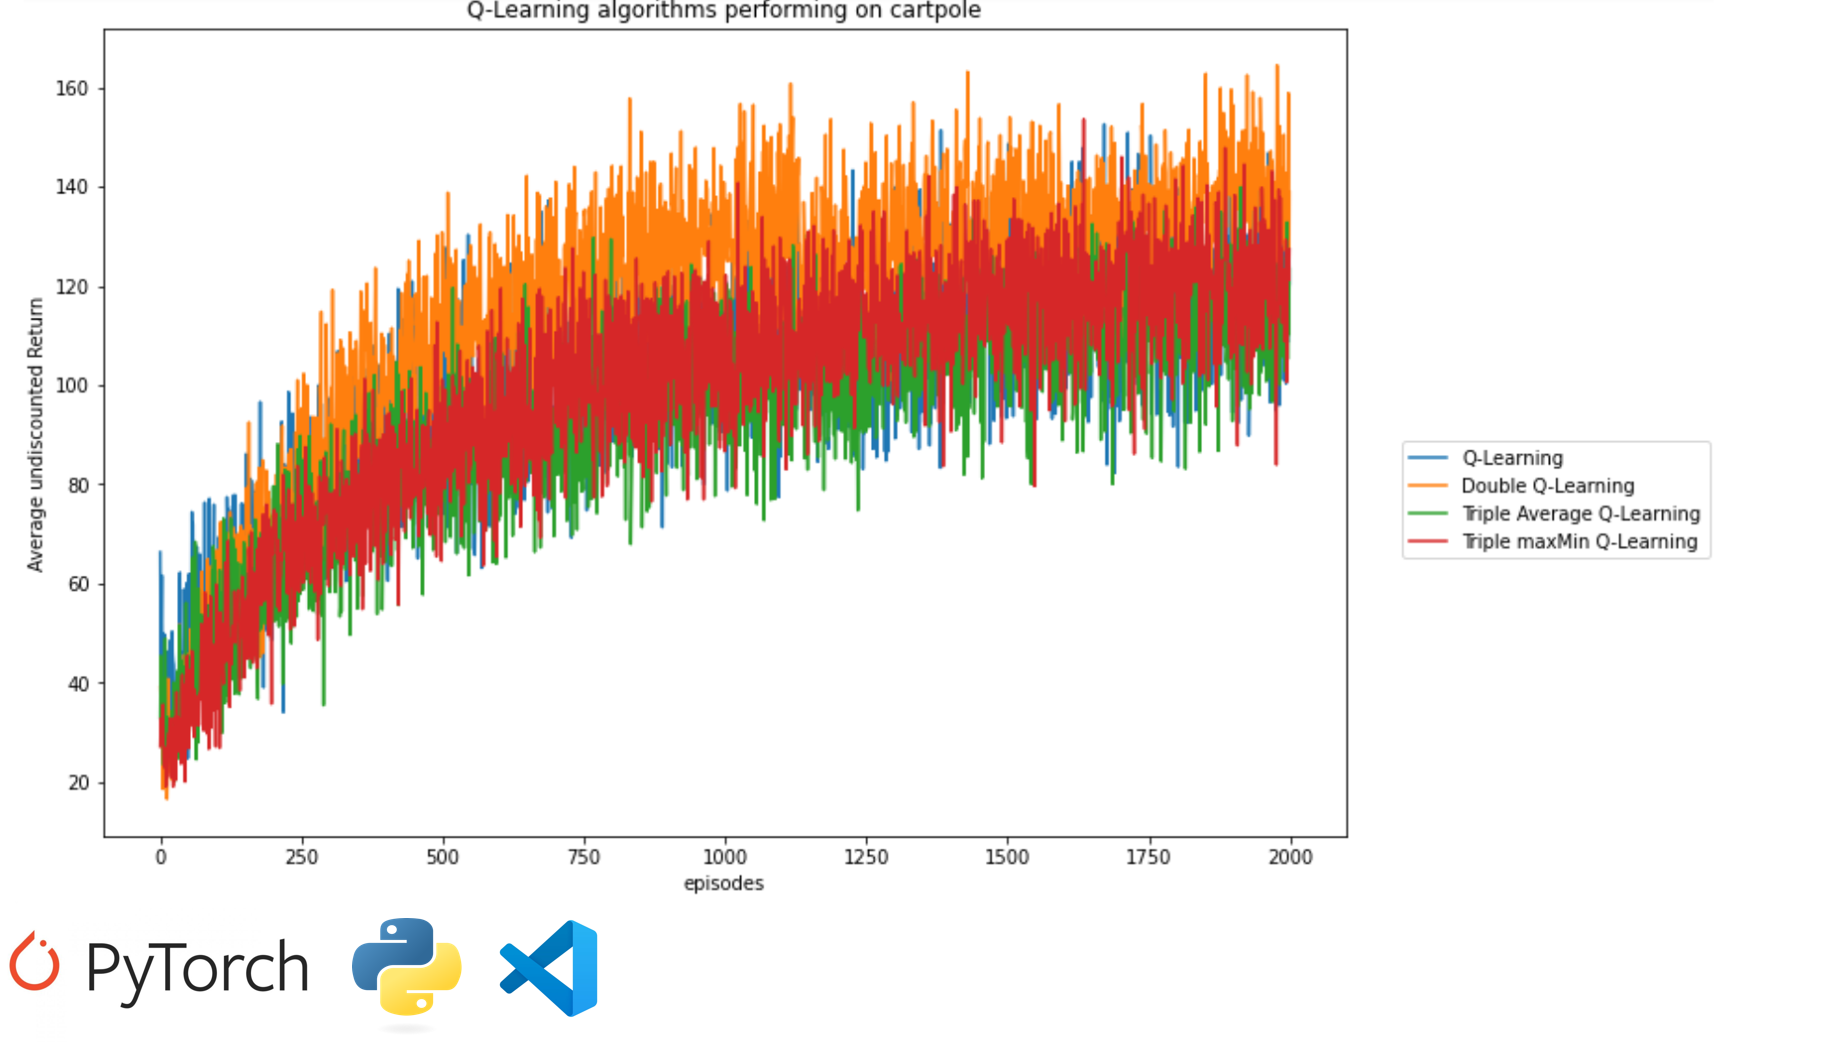
This works aimed to study double Q-learning on discrete and continuous state-space actions with different environments. Get the paper here !
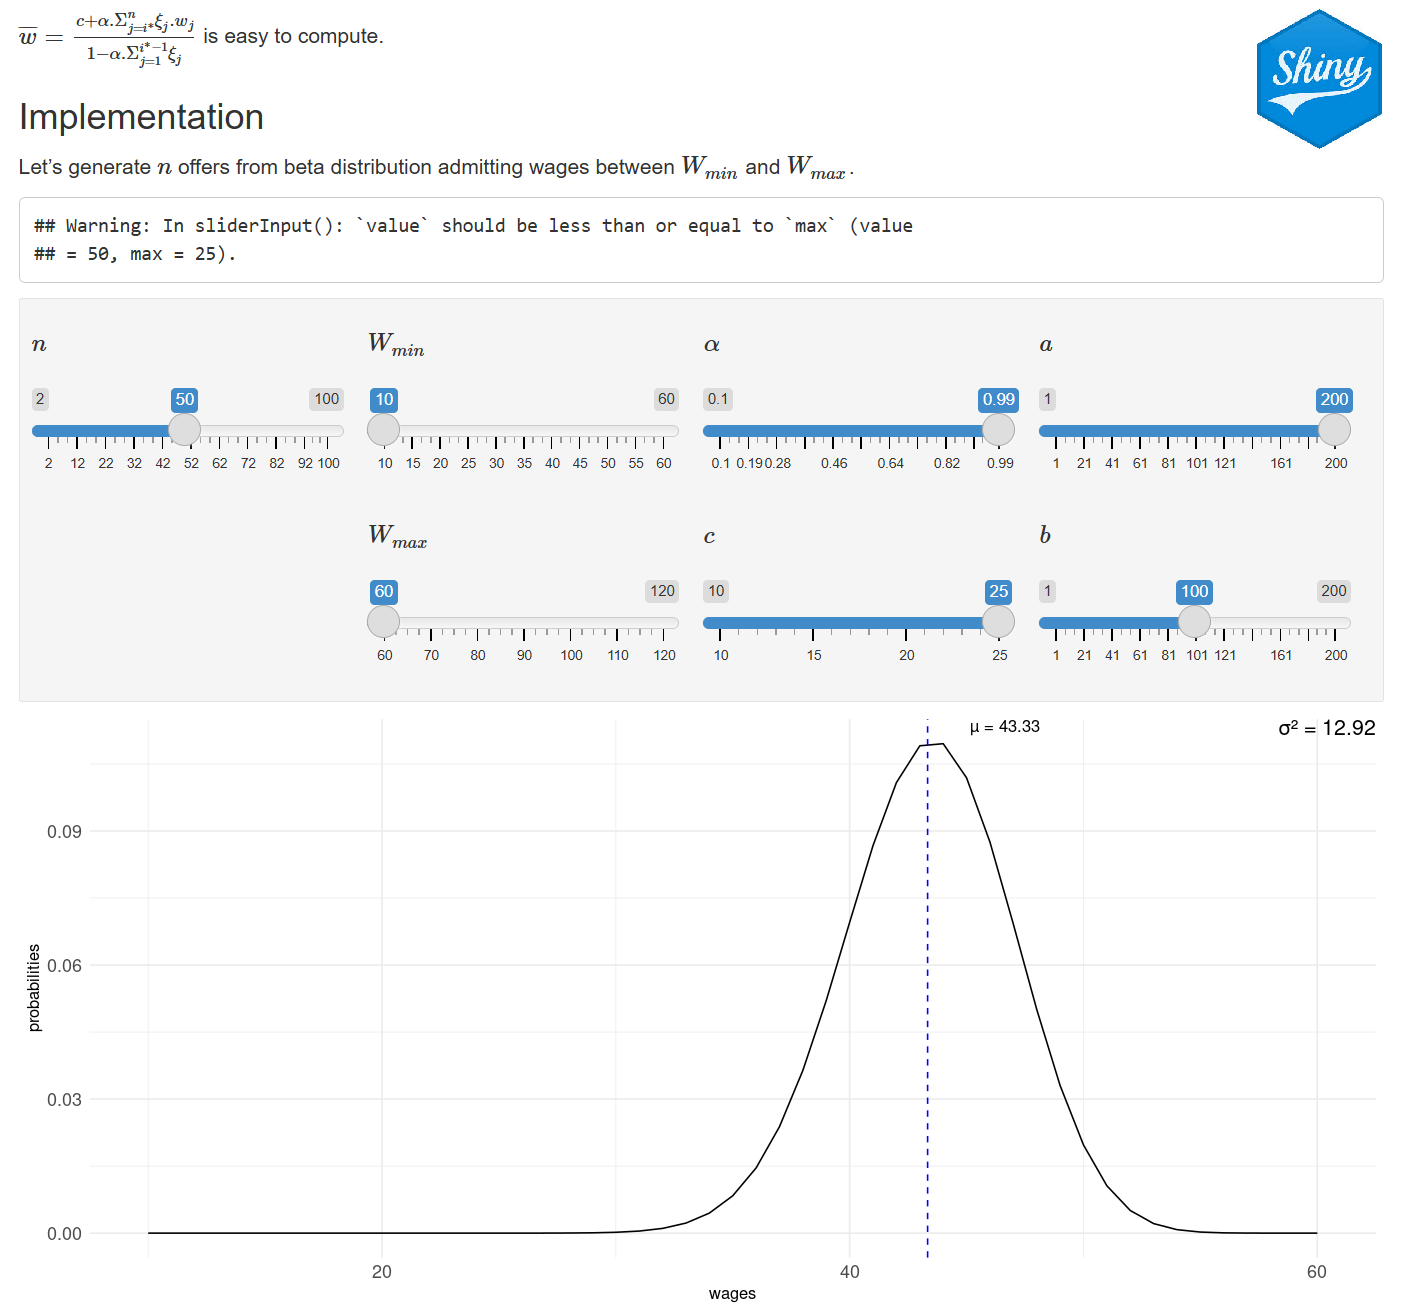
You can run simulations on salaries distributions and evaluate at which rate you start to consider a job offer to be an obvious opportunity. Read here !
Over 4+ years of experience working with companies from all over the world. I design & develop data products to help businesses increase profitability and improve customer experience.
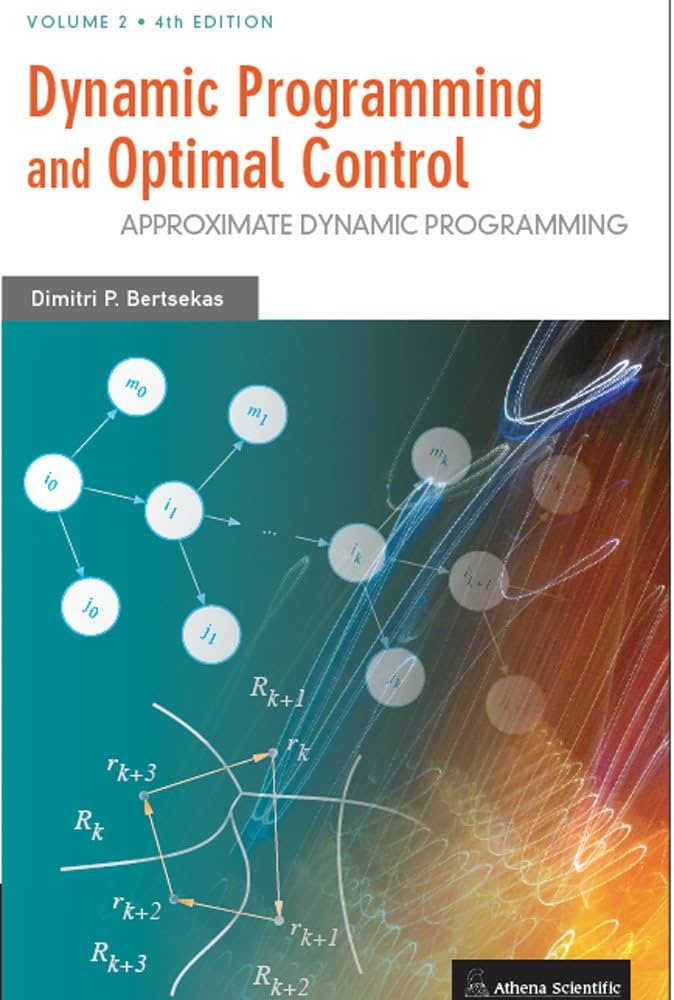
Linkedin Download My ResumeThe content of this book is widely shared in youtube tutorials by the author, however I enjoyed the paper version alongside the video they were able to make direct massive impact on my consideration while building a dashboard.
I'm still reading it ...
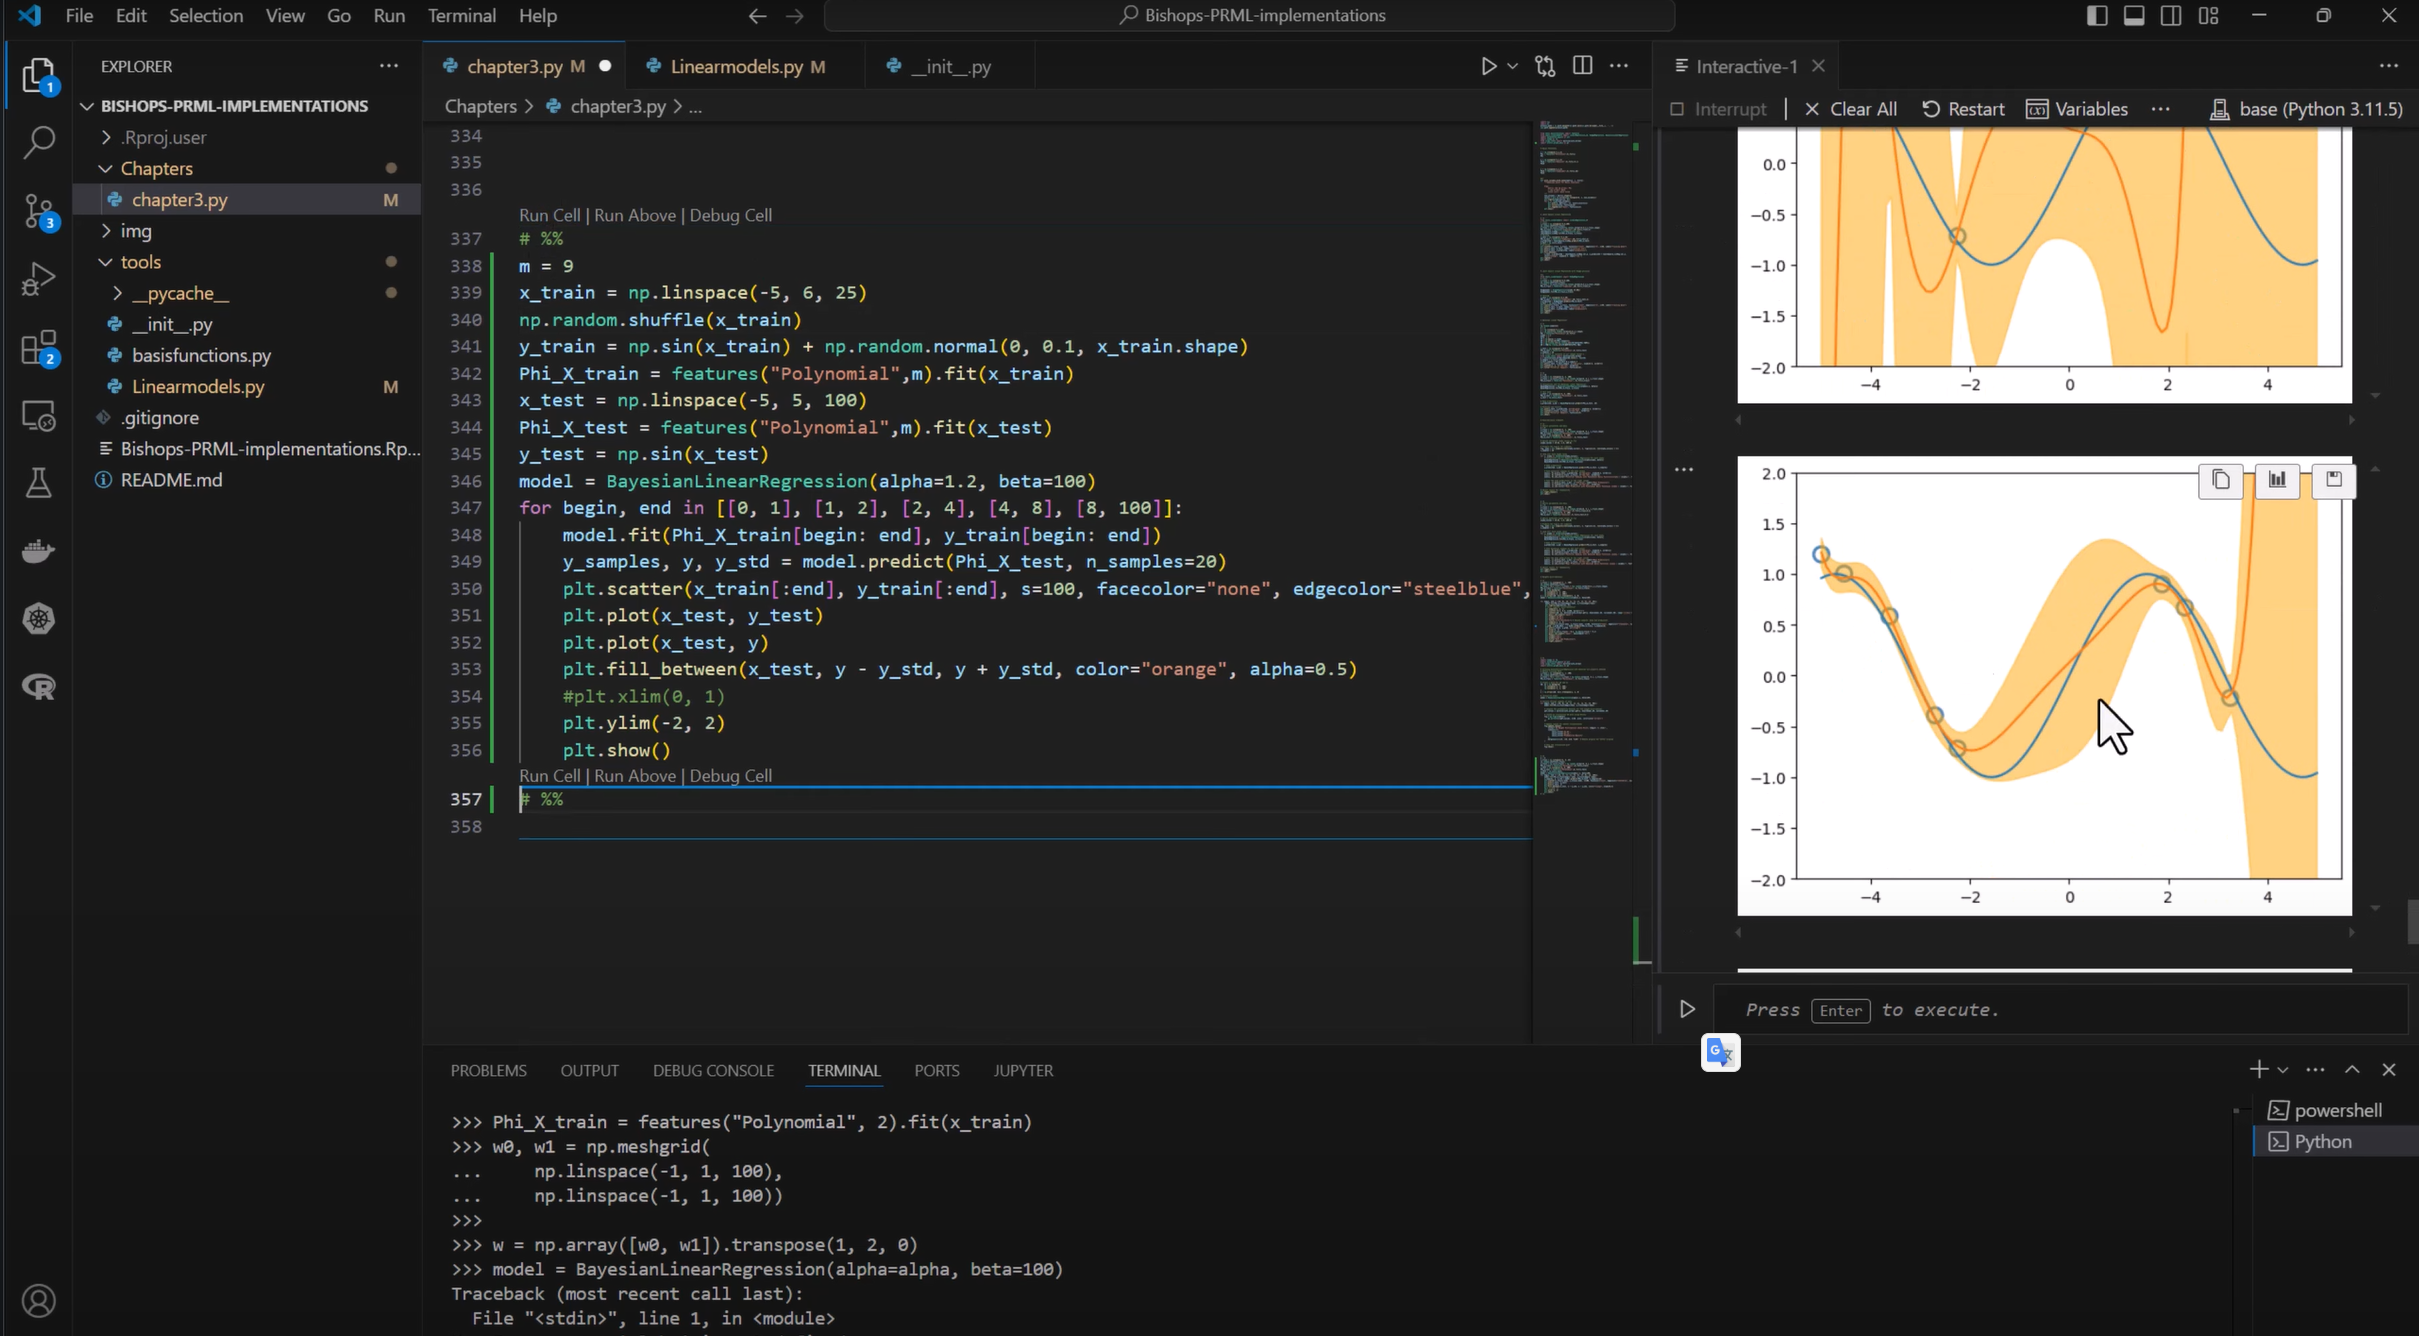
I still have chapters to go for deep understanding however I managed to implement live all contents of chapter 3 on my youtube channel for arabic speakers. This book is your ML bible !
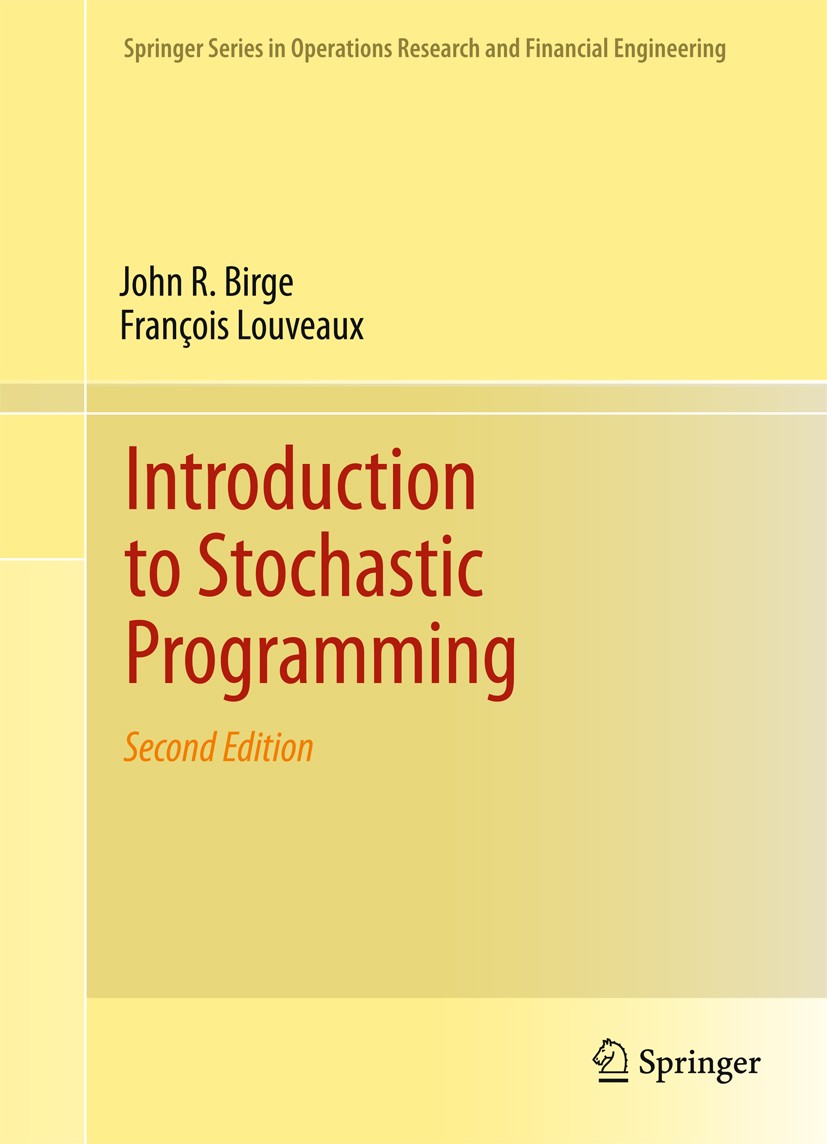
I didn't enjoy much this book as I did for the same content of Dimitri's book...though I may consider it a good beginning to put hands on RL.
Much effort to put in here ! not easy at all
at first, it's super hard but you get used to it. On my channel there are problems I solved while explaining essentails of this gem and Dimitri's DP as well !
Talented, technically solid and very driven Data Analytics Scientist. Ali joined my team in France to work on his graduation Internship. His inquisitive nature and strong ability to learn allowed him to quickly understand the basis principles of a new domain for him, agriculture, and effectively apply his data science knowledge to work on specific business problems. He demonstrated solid Project Management skill, delivering good-lasting value to the team and committing to timelines. His optimistic nature and always positive attitude made it enjoyable for the team to work with him. Ali will be a great asset to any team looking for a solid Data Analytics' Scientist.
Ali is an excellent professional, I was able to assist him during his internship at Monsanto legacy/ Bayer. He is very proactive and committed to self-development, is always looking to be collaborative in projects and has a very expressive Statistical/ Programming background. It was a pleasure working with you Ali!
Working with Ali at Axe finance was such a blessing. His tremendous spirit to learn and move forward with the projects was very inspiring. He is a valuable member for the team and I highly recommend him.